Dying in Childbirth
If you’ve had a child or two, as I have, it’s difficult to look at maternal mortality rates and not consider them personally. Giving birth can be hard and scary work, even with the help of the best attendants and most high-tech medical facilities the developed world can offer. That’s why a graph like the one below is so unsettling—for all that it says about the conditions other mothers must endure, and for the stark fact that so many don’t survive.
To understand the graph a little better, and why it’s a useful tool for the kind of work we do, listen to Miriam Aschkenasy’s explanation:
[audio:http://oxfamamericablogs.s3.amazonaws.com/wp-content/uploads/2008/10/maternal-mortality.mp3]She’s Oxfam America’s public health specialist and an emergency room physician. This graph was put together for our humanitarian response department, which wanted to gauge the rates in some of the countries in which we work and compare them with western countries.
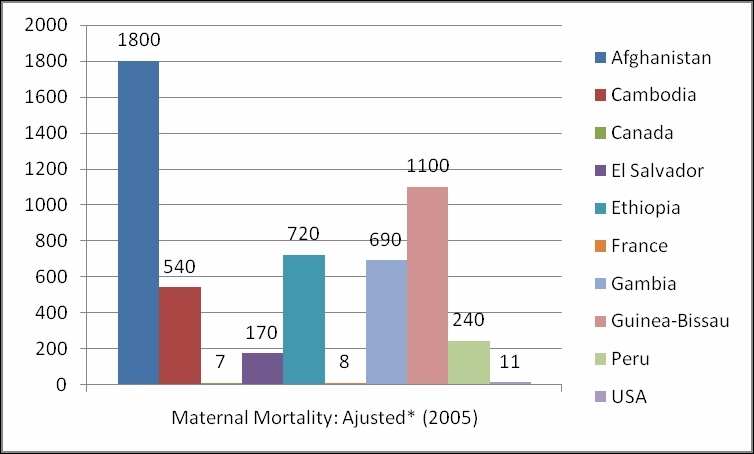
This graph shows the rates of maternal mortality per 100,000 live births in nine countries.
*The numbers have been adjusted to correct for misclassification and underreporting.